
Table 2. Baseline characteristics of the ATTICA study participants according to 10-year diabetes incidence (n = 1,485).
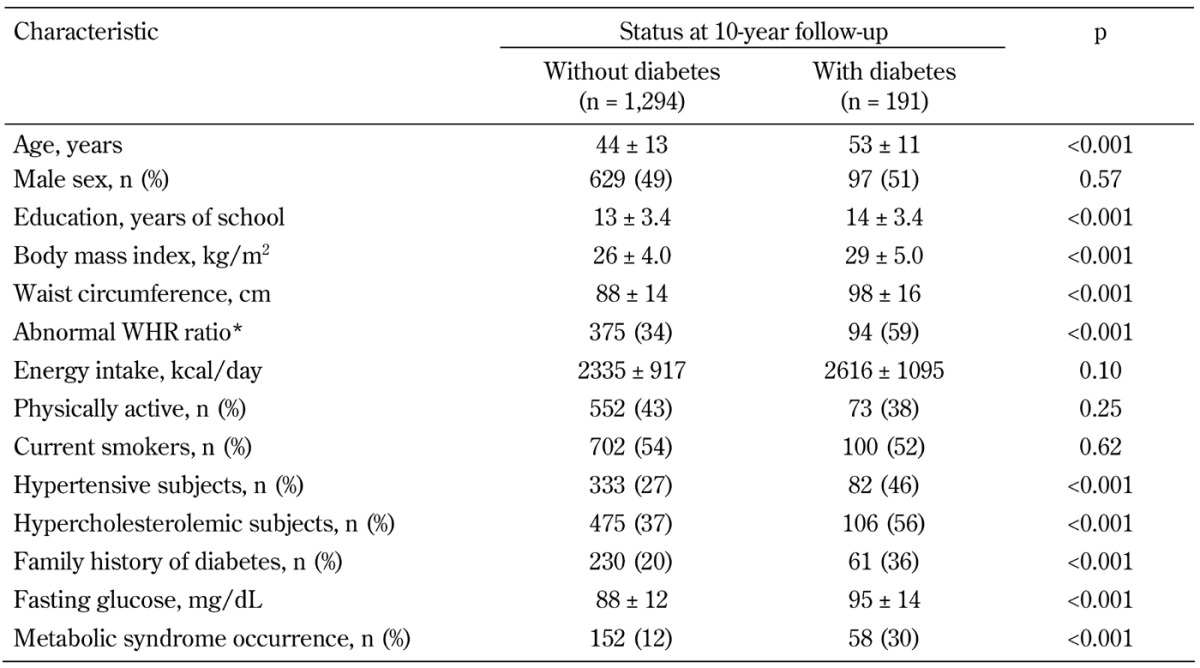
Legend: Data are presented as mean values and standard deviation or absolute and relative frequencies. P-values were derived from Student's t-test for the normally distributed variables and Mann-Whitney test for the non-normally distributed variables (i.e., years of school, fasting glucose), or chi-square test for the categorical variables. * >0.8 for women and >1.0 for men.