
Table 3. Factor coefficient for foods or food groups consumed by the Greek ATTICA study participants (n = 1,485) at baseline.
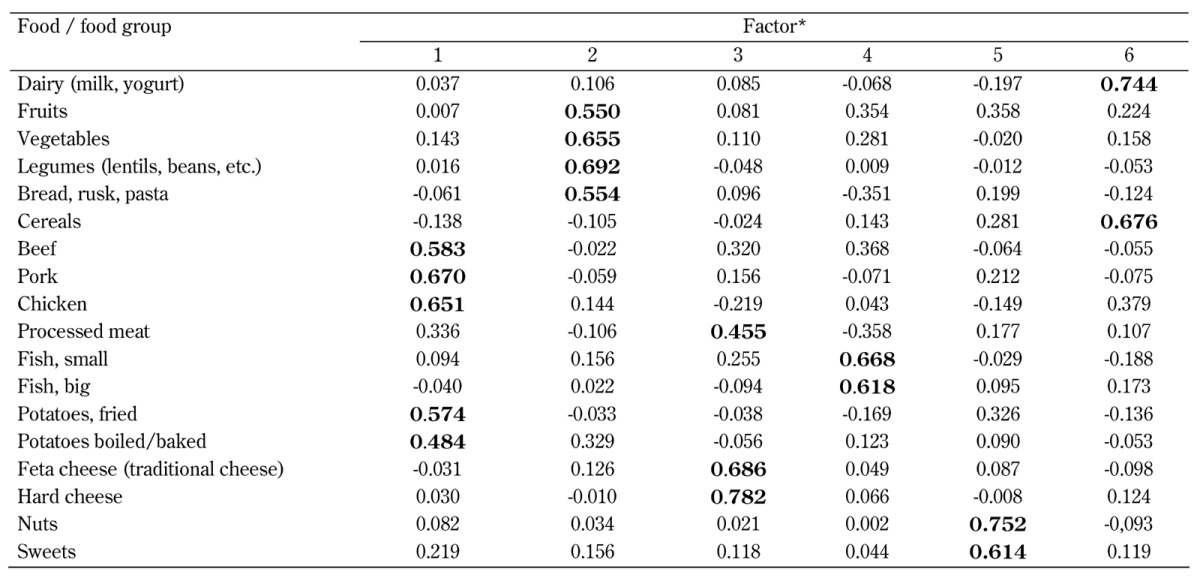
Legend: Score coefficients were similar to the correlation coefficient, with higher absolute values indicative of higher correlation between the (food) variable and the respective factor. * The patterns were predominantly characterized by the consumption of meat and potatoes (Factor 1), fruits, vegetables, legumes, bread, rusk, and pasta (Factor 2), processed meat and cheese (Factor 3), fish (Factor 4), nuts and sweets (Factor 5), dairy and cereals (Factor 6).