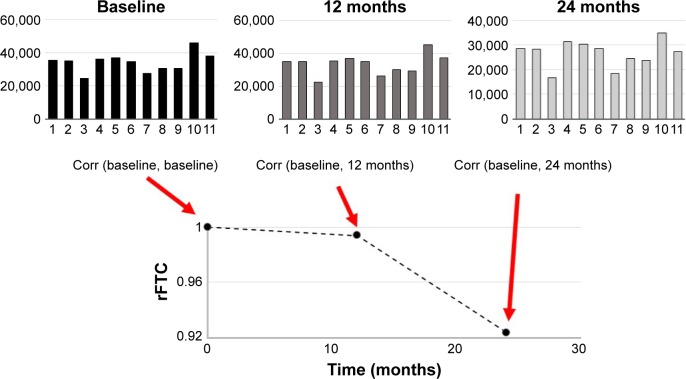
Figure 1.
Illustration of the rFTC calculation.
Notes: The top plots show the FDG vectors obtained from a single subject’s FDG-PET scans at baseline, 12 months, and 24 months. The length of the vector represents the non-normalized mean FDG-PET activities in 11 cortical regions (left and right frontal lobes, posterior and anterior cingulate cortexes, occipital lobe, left and right parietal lobes, left and right temporal lobes, sub-lobar region, and mid brain). The subject’s rFTC trajectory is obtained by calculating the weighted correlation coefficients between the subject’s baseline FDG vector and those from each follow-up time point.
Abbreviations: Corr, correlation coefficient; rFTC, regional FDG time correlation coefficient; FDG, [18F]fluorodeoxyglucose; PET, positron emission tomography.

