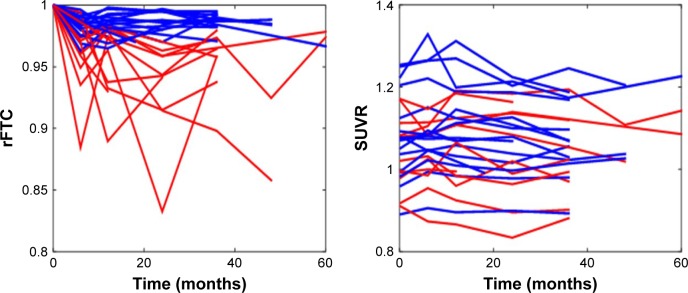
Figure 2.
rFTC and composite ROI SUVR trajectories of all subjects.
Notes: Some subjects maintained high rFTC values (blue lines) and others had declining values (red lines) over time. The threshold for abnormal rFTC decline was set at 0.97.
Abbreviations: rFTC, regional FDG time correlation coefficient; ROI, region of interest; SUVR, standardized uptake value ratio.

