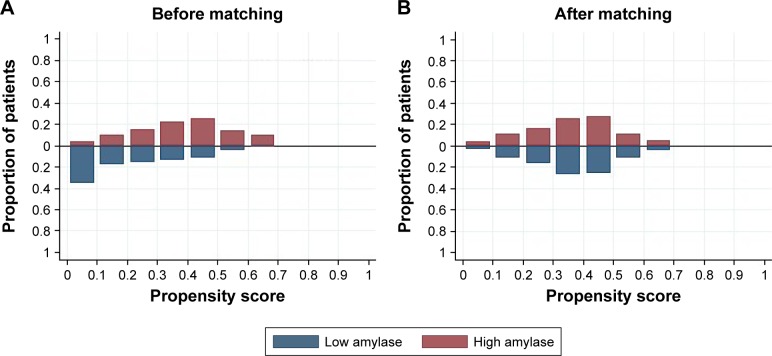
Figure 1.
Distribution of propensity scores in the entire cohort before matching (A) and in the propensity score-matched groups after matching (B) for age, gender, time interval before admission, hematocrit, blood urea nitrogen and creatinine. The estimated propensity scores of each patient represent predicted probability or likelihood that the patients were in the low-amylase group.

