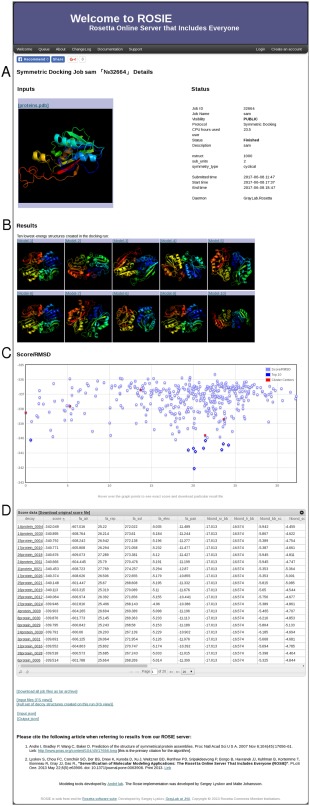
Figure 2.

A ROSIE result page, showing output elements. A: The JobHeader widget provides details about the protocol run. B: The TopModels widget shows the selected result structures. Each structure can be downloaded by clicking on it. C: The ScorePlot widget displays a plot of two selected scores. Additional information for each point can be obtained by hovering over it. D: The ScoreTable widget. The results can be sorted by each column, and any particular structure can be downloaded by clicking its name.
