
Figure 3.
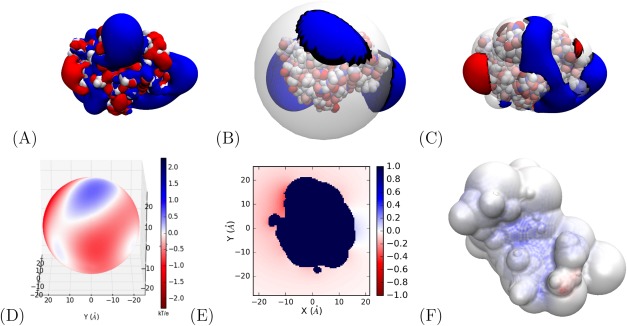
Comparison of APBS, PB‐AM, and PB‐SAM results (A–C) and electrostatic potential visualization for APBS PB‐AM and PB‐SAM (D–E). VMD64 isosurface of barnase molecule generated using (A) APBS boundary element method, (B) APBS PB‐AM method, and (C) APBS PB‐SAM method. (A–C) atoms colored according to their charge and isosurfaces are drawn at 1.0 (blue) and −1.0 (red) kT/e electrostatic potential. (D) APBS PB‐AM potential on the coarse‐grain surface of the barnase molecule, (E) APBS PB‐SAM potential in a 2D plane surrounding the barstar molecule, and (F) APBS PB‐SAM potential over range on the coarse‐grain surface of the barnase molecule (blue region is the location of positive electrostatic potential and barstar association). All calculations were performed at 0.0 M ionic strength, 300 Kelvin, pH 7, protein dielectric 2, and solvent dielectric 78. All electrostatic potentials are given in units of kT/e.