
Figure 5.
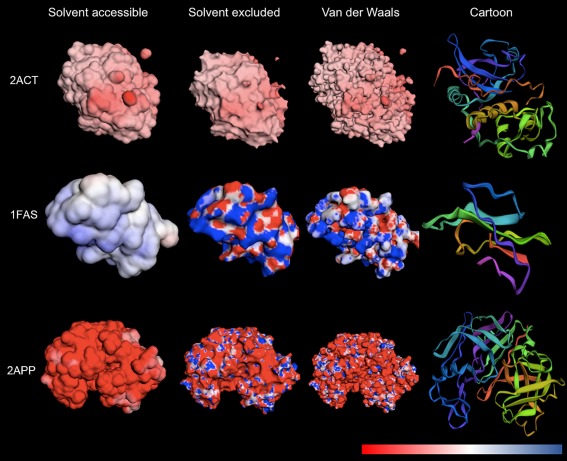
Renderings of three different proteins: actinidin (2ACT) (top), fasciculin‐2 (1FAS) (center), and pepsin‐penicillium (2APP) (bottom). To demonstrate the different visualization options. From left to right: solvent‐accessible surface, solvent‐excluded surface, van der Waals surface, and cartoon models are shown all using red–white–blue color scheme (excluding cartoon model), where red and blue correspond to negative and positive electrostatic potentials, respectively.