
Figure 3.
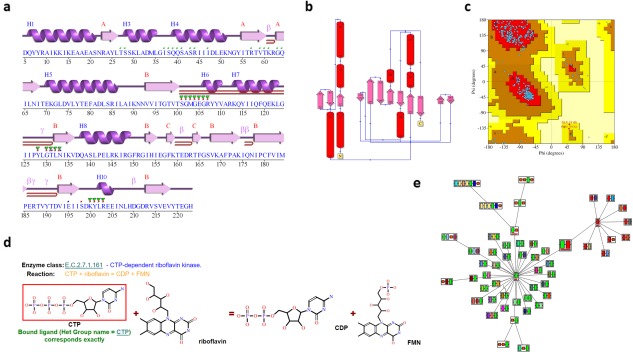
More PDBsum analyses for PDB entry 5trd. (A) Schematic “wiring diagram” of the protein's secondary structure—including strands (pink arrows), helices (purple springs), and other motifs in red (e.g., β‐hairpins, γ‐turns, etc); (B) schematic diagram illustrating the protein's topology in terms of how the β‐strands (pink arrows) are arranged into β‐sheets, and the relative disposition of the α‐helices (red cylinders); (C) Ramachandran plot from PROCHECK showing the distribution of the protein's main chain φ‐ψ torsion angles (blue squares) relative to the “core” (red) and “allowed” (brown) regions, with residues falling in the “generously allowed” (dark yellow) and “disallowed” (pale yellow) regions plotted as red squares and labeled; (D) enzyme reaction diagram for E.C. 2.7.1.161 showing the reactants and products involved. The substrate molecule, CTP, is highlighted in red as it is present in the 5trd structure; (E) ArchSchema network of related domain architectures, the enlarged, gray box representing the two‐domain architecture of 5trd (green and red boxes), and the other architectures featuring either the green or red domains.