
Figure 4.
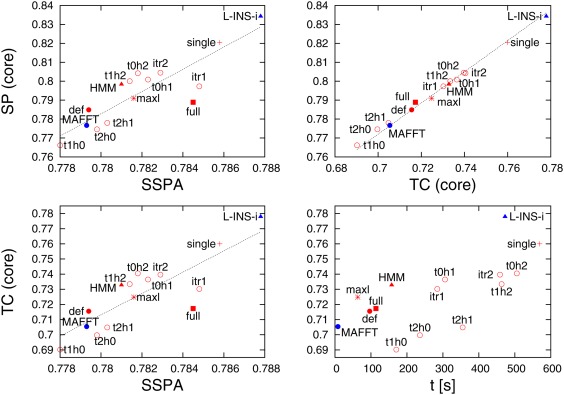
Performance measures for different aligners/command‐lines for QuanTest. Top‐left panel shows sum‐of‐pairs (SP) score versus secondary structure prediction accuracy (SSPA). Bottom‐left panel shows total column (TC) score versus SSPA score. Top‐right panel shows SP score versus TC score. Bottom‐right panel shows TC score versus execution time. Colour scheme and symbol shapes are the same as in Figures 1 and 2