Figure 1.

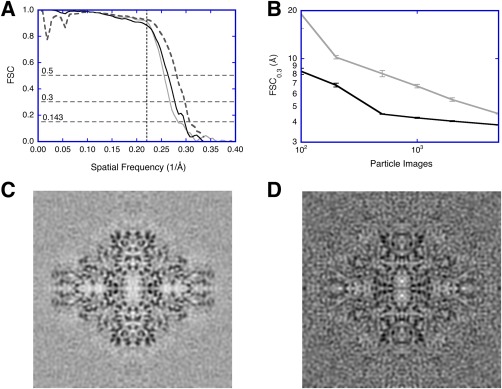
Validation issues in SPA using a public data set of ß‐galactosidase micrographs (https://www.ebi.ac.uk/pdbe/emdb/empiar/entry/10013/).22 The micrographs were split into two independent sets. Within each set, particles were aligned with resolution limits, and two half‐maps calculated to assess resolution. The full maps from the two independent sets were also compared to assess resolution (see Fig. 2 for workflows). (A) FSC curves for the final reconstructions from resolution‐limited processing of one micrograph set (gray), from the two independent data sets (black), and compared to the published map (EMD 5995)22 as repetition with different software packages (dashed). The horizontal dashed lines indicate the different cutoffs used (0.143, 0.3, and 0.5). The vertical dashed line at 4.5 Å (spatial frequency 0.222/Å) indicates the resolution limit used in the alignment. (B) Test for coherence:23 The resolution (FSC0.3) of reconstructions calculated from aligned noise images (gray) compared to those from real images (black). Each point is the average and standard deviation of ten assessments done with random selection of particle or noise images. (C) Reconstruction from 5000 real images. (D) Reconstruction from 5000 aligned noise images
