Figure 1.

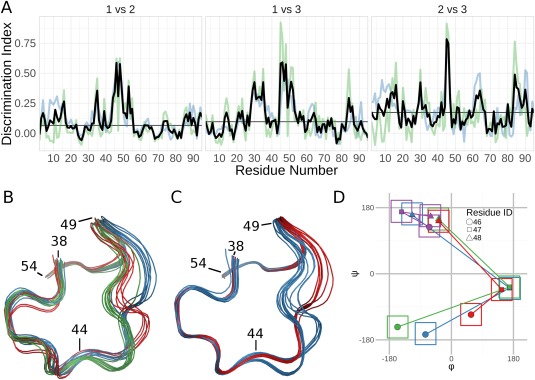
Analysis of the solution structure of RNase Sa. (A) Discrimination Index (DI) plots for the pairwise comparisons of the three groups identified by the Ensemblator. The residue‐based global DI (blue) and the local DI (green) are averaged to create the unified DI (red). The median unified DI is also indicated (black line). (B) Wire‐diagram tracing of the backbone path in the region of largest inter‐group difference (residues 44–49): Group 1 (blue; models 1,2,7,8,10,13–15); Group 2 (green; models 3–6,9,11,12); Group 3 (red; models 16–20). (C) Wire‐diagram as in (B), for groups identified by analysis of only residues 38–58: Group 1 (blue; models 3–7,9,12,16–20); Group 2 (red; models 1,2,8,10,11,13–15). The tighter backbone spread results from the more local overlay. (D) φ,ψ values for residues 46 (circles), 47 (squares), and 48 (triangles) representative of the three groups shown in panel (B) (blue, green, red) and the X‐ray structures (purple). The ±30° boxes indicate the areas used in Protein Geometry Database11 searches for tripeptides present in structures solved at 1.5‐Å resolution or better that have no more than 25% sequence identity to one another. The tripeptide conformation in all the X‐ray models was found 467 times (0.34% of all tripeptides), while zero occurrences were found for the NMR conformations.
