Figure 3.

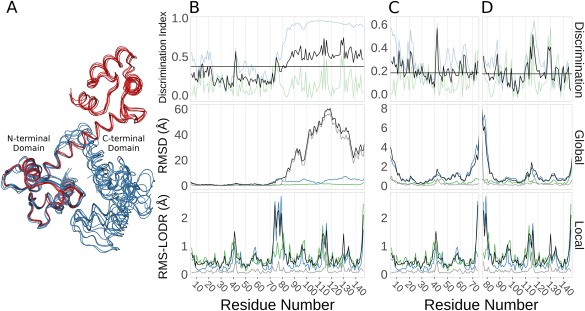
Ensemblator analysis of calmodulin (CaM) crystal structures. (A) Wire‐diagram backbone tracing for the ligand‐bound models (blue), and the ligand‐free models (red), as overlayed by the Ensemblator. (B) Discrimination indices (top panel; global (blue), local (green), unified (black), and median unified (horizontal black line)), and RMSDs from the global (middle panel) and local (bottom panel) comparisons for the entire CaM protein. In the global and local comparisons, the within group variation is shown for the ligand‐bound (green) and ligand‐free (blue) conformations. Also indicated is the inter‐group variation (black) and the closest approach distances (grey). (C) As in (B), except the analysis only included the N‐terminal domain. (D) As in (B), except the analysis only included the C‐terminal domain.
