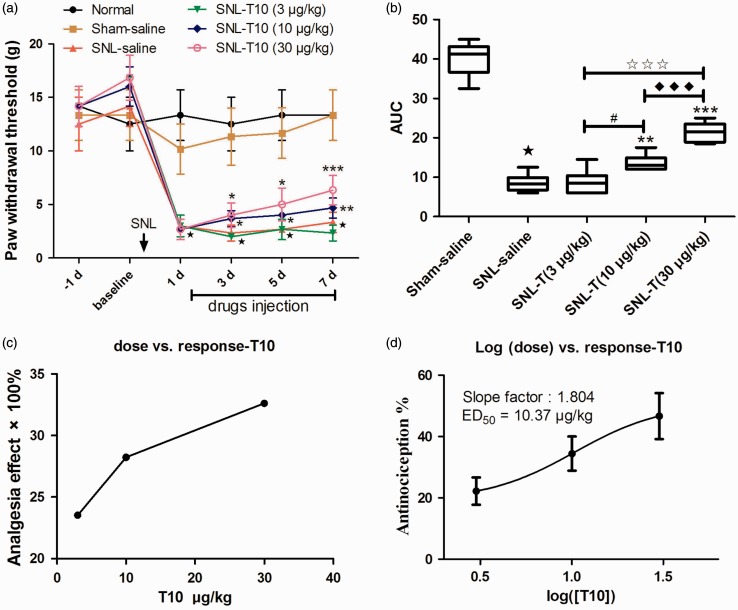
Figure 2.
T10 dose dependently inhibited SNL-induced mechanical allodynia of the ipsilateral hind paw. (a) The analgesia effects of different doses of i.t. T10. (b) The AUCs for the different groups were calculated for statistical analysis. (c–d) The dose-effect and log (dose)-effect curves for the analgesic effects in attenuating SNL-induced mechanical allodynia after i.t. saline and T10, respectively. ⋆P < 0.001, SNL saline group versus sham saline group; *P < 0.05, **P < 0.01, and ***P < 0.001, SNL-T10 groups versus SNL saline group; #P < 0.05, SNL-T10 (10 µg/kg) versus SNL-T10 (3 µg/kg) group; ♦♦♦P < 0.001, SNL-T10 (30 µg/kg) versus SNL-T10 (10 µg/kg) group; ★★★P < 0.001, SNL-T10 (30 µg/kg) versus SNL-T10 (3 µg/kg) group. AUC: area under curve; SNL: spinal nerve ligation; ED50: effective dose 50.

