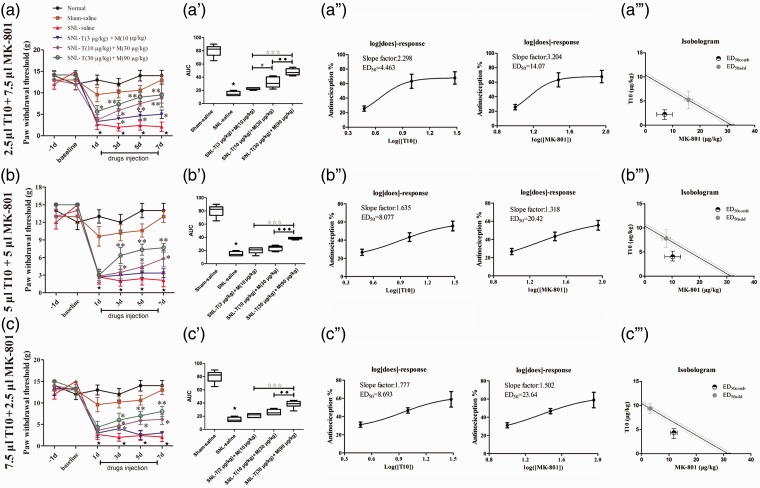
Figure 4.
Combination treatment of T10 or MK-801 with different ratios. (a, b, and c) The analgesia effect of different volumes of i.t. T10 or MK-801 with different dose ratios. (a′, b′, and c′) The AUCs for different groups were calculated to perform statistical analysis. (a′′, b′′, and c′′) The dose-effect and log (dose)-effect curves for the analgesic effects in attenuating SNL-induced mechanical allodynia after i.t. saline, T10 and/or MK-801. (a′′′, b′′′, and c′′′) The iosobolograms for the combination analgesia. ⋆P < 0.001, SNL saline group versus sham saline group; *P < 0.05, **P < 0.01, SNL-T+M groups versus SNL saline group; #P < 0.05, SNL-T (10 µg/kg)+M (30 µg/kg) groups versus SNL-T (3 µg/kg)+M (10 µg/kg) groups; ♦♦P < 0.01 and ♦♦♦P < 0.001, SNL-T (30 µg/kg)+M (90 µg/kg) groups versus SNL-T (10 µg/kg)+M (30 µg/kg) groups; ★★★P < 0.001, SNL-T (30 µg/kg)+M (90 µg/kg) groups versus SNL-T (3 µg/kg)+M (10 µg/kg) groups. AUC: area under curve; SNL: spinal nerve ligation; ED50: effective dose 50.

