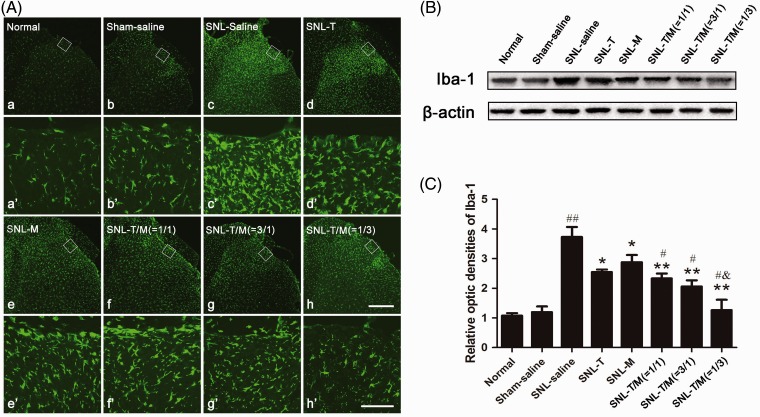
Figure 6.
Administration of T10, MK-801, or their combination on SNL-induced microglial activation. Immunofluorescent results showed that SNL induced up-regulation of Iba-1 in the ipsilateral SDH (A; c and c′). Administration of individual or concomitant drugs down-regulated Iba-1 expression in the ipsilateral SDH on day 3 (d–h and d′-h′ ). The rectangle areas in a–h are enlarged in a′-h′, respectively. (B) Western blot of Iba-1 expression at day 3 in groups with saline or drug treatment. (C) The relative optic densities of Iba-1 shown in (B). ##P < 0.001, SNL saline group versus sham saline or normal group; *P < 0.05, **P < 0.01, SNL-T group, SNL-M group, SNL-T/M (1/1) group, SNL-T/M (3/1) group, SNL-T/M (1/3) group versus sham saline group, respectively; #P < 0.05, SNL-T/M (1/1) group, SNL-T/M (3/1) group, SNL-T/M (1/3) group versus SNL-T group and SNL-M group, respectively; &P < 0.05, SNL-T/M (1/3) group versus other mixed drugs groups. Scale bars = 40 µm in a–h and 200 µm in a′-h′. AUC: area under curve; SNL: spinal nerve ligation.

