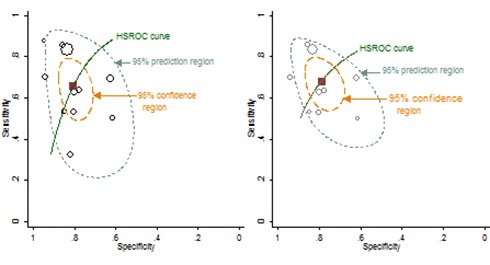
Figure 4.

Hierarchical meta-analysis of trough infliximab levels for predicting loss of response or failure to regain response. Left, all 11 studies; right, responder studies only (n=9). The square symbol represents the summary point estimate on the hierarchical summary receiver operating characteristic (HSROC) curve.
