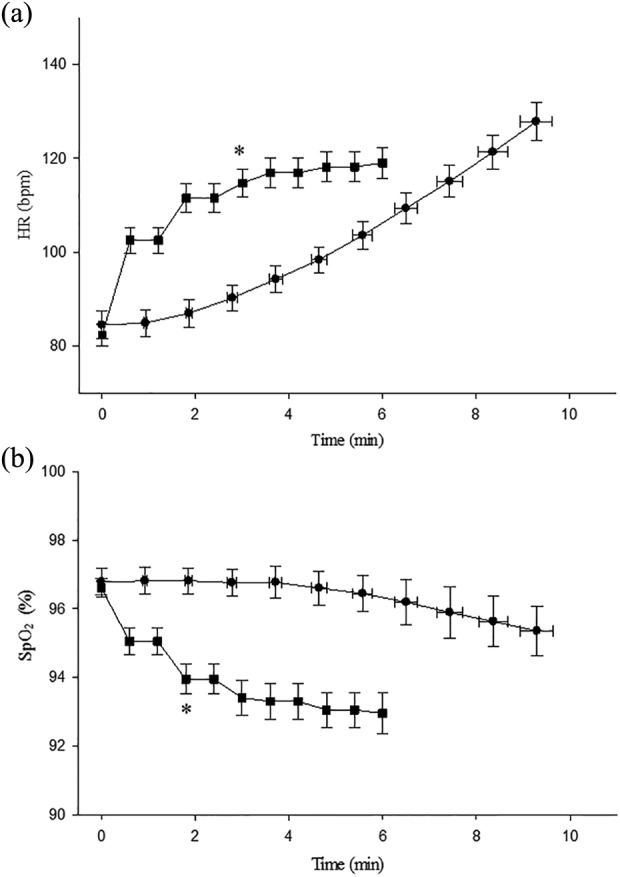
Figure 1.

Patterns of responses for: (a) HR and (b) peripheral SpO2 for each test. Data are represented as mean and standard error. All participants contributed to each decile (data point). •: CPET; ▪:6MWT. For the CPET, time 0 (zero) is the start of the ramp. *Plateau from this data point to test completion. HR: heart rae; SpO2: capillary oxygen saturation; CPET: cardiopulmonary exercise test; 6MWT: six-minute walk test.
