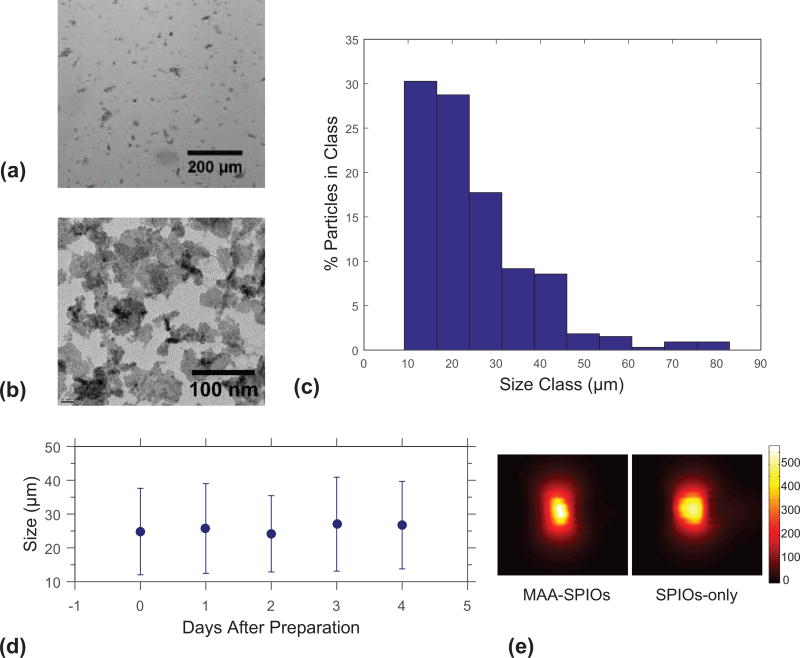
Figure 2.
Characterization of of MAA-SPIOs. (a) Brightfield image of MAA-SPIOs. 200 µm scale bar. (b) TEM image of perimag SPIO clusters. 100 nm scale bar. (c) Histogram of MAA-SPIO size distribution (of 327 particles measured). (d) Size stability of MAA-SPIOs in saline over five days (~200–300 particles measured each day). (e) MPI scans of roughly 2 million MAA-SPIO and equivalent iron concentration SPIO only phantoms, each in 80 µL water. Colorbar for both scans in µg Fe/cm3.

