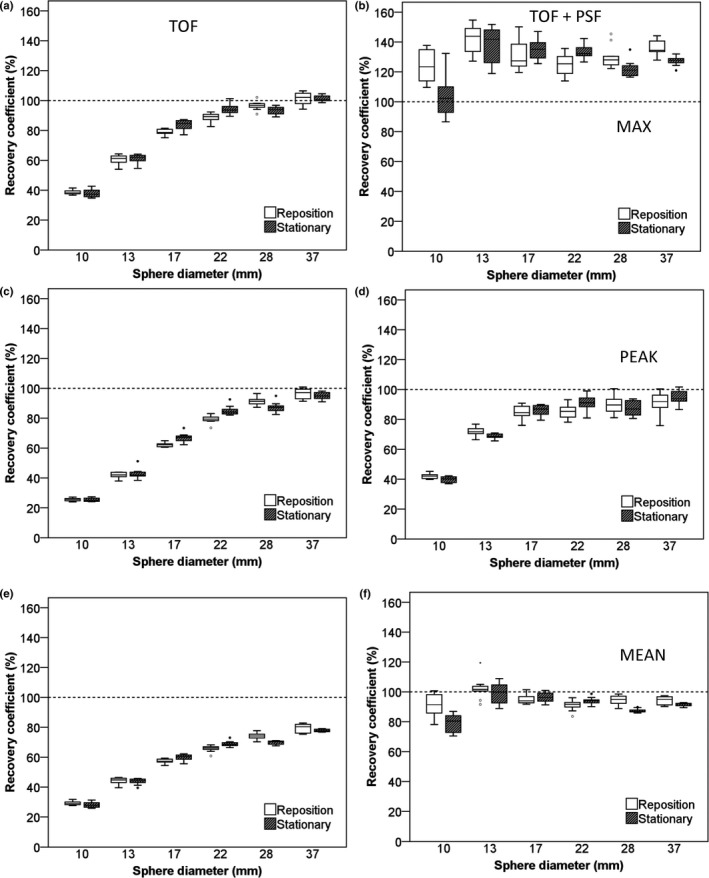
Figure 3.

RC of NEMA IQ phantom data as a function of sphere diameter. Data were acquired on the Siemens Biograph system and based on images with a 3.1819 × 3.1819 × 2 mm voxel size and 5‐min starting frame duration using TOF on the left column and TOF + PSF on the right column. Figures (A and B) represent RC (%) for max, (C and D), peak, and (E and F) mean SUVs. Dotted lines correspond to the true RC based on the true activity within the phantom spheres. Boxes represent standard deviation (SD), whiskers show ranges, and solid line depicts median of the data.
