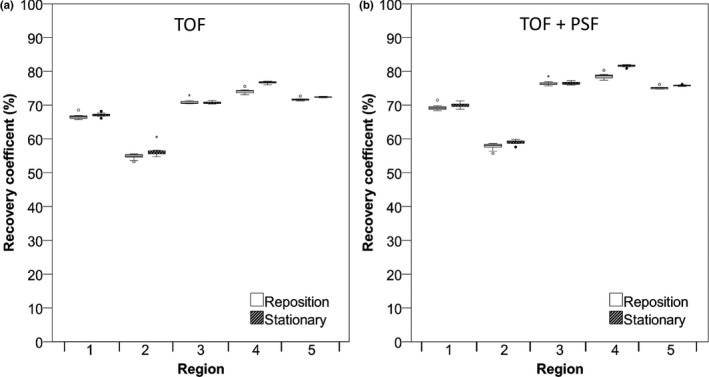
Figure 6.

RC (%) of Hoffman phantom data in different gray matter regions. Data were acquired on the Philips Ingenuity system and reconstructed using TOF (A) and TOF + PSF (B). RC for 5‐min frame duration are shown. Boxes represent standard deviation (SD), whiskers show ranges, and solid line depicts median of the data.
