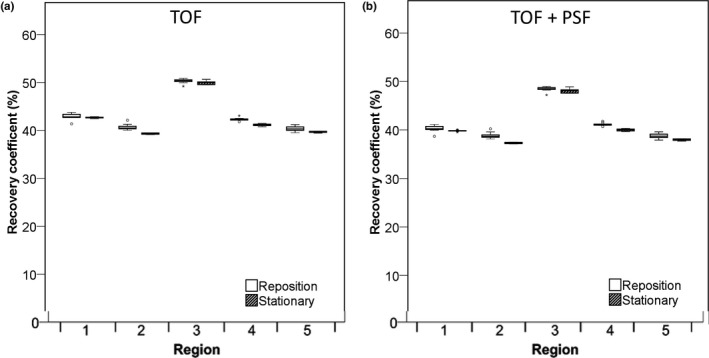
Figure 7.

RC (%) of Hoffman phantom for different white matter regions. Data were acquired on the Philips Ingenuity system and reconstructed using TOF are shown (A) and with TOF + PSF in (B). Data for 5‐min frame durations are shown. Boxes represent standard deviation (SD), whiskers show ranges, and solid line depicts median of the data depicts median of the data.
