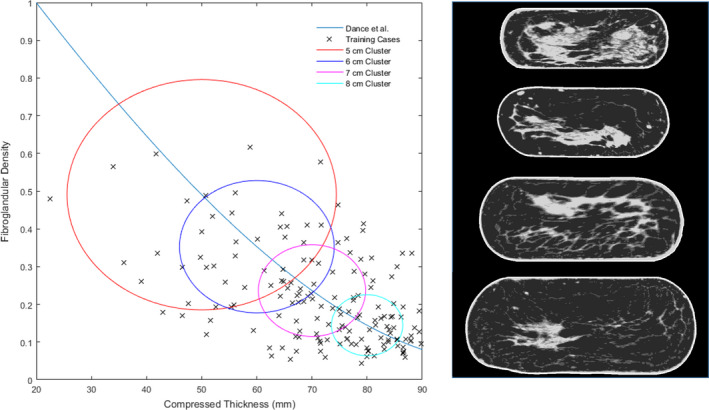
Figure 4.

The 4 size/density clusters are shown along with a sample case from each cluster mapped to their corresponding compressed template at thicknesses of 5, 6, 7, and 8 cm. The relationship between breast thickness and fibroglandular density observed by Dance et al. is also shown. [Color figure can be viewed at wileyonlinelibrary.com]
