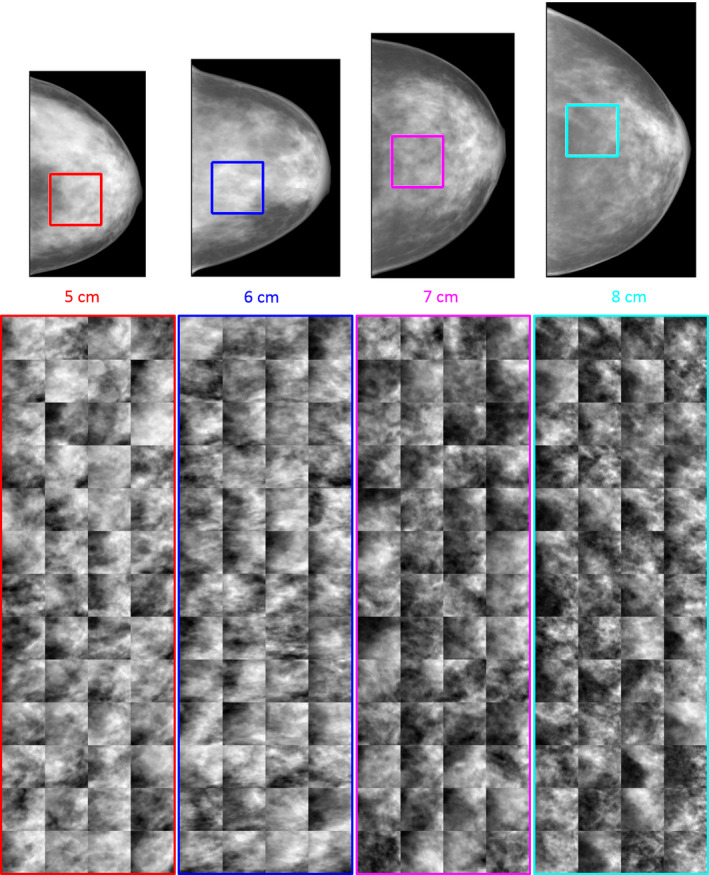
Figure 9.

Simulated mammographic projection from the synthetic breast phantoms are shown to scale (top) with ROIs indicating the region shown for 52 unique cases in each of the 4 clusters (bottom). [Color figure can be viewed at wileyonlinelibrary.com]
