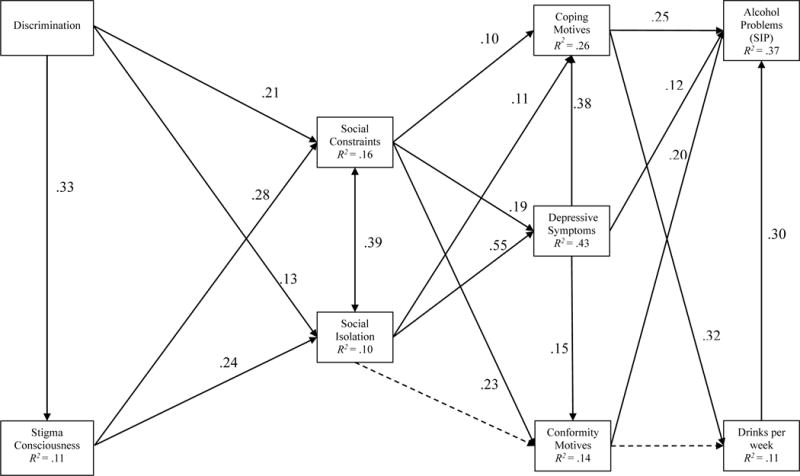
Figure 2.

Path model predicting alcohol use and problems among lesbian women. Based on bootstrapped confidence intervals, solid lines represent significant effects and dash lines represent nonsignificant effects. There is a correlation between coping and conformity motives that is not depicted.
