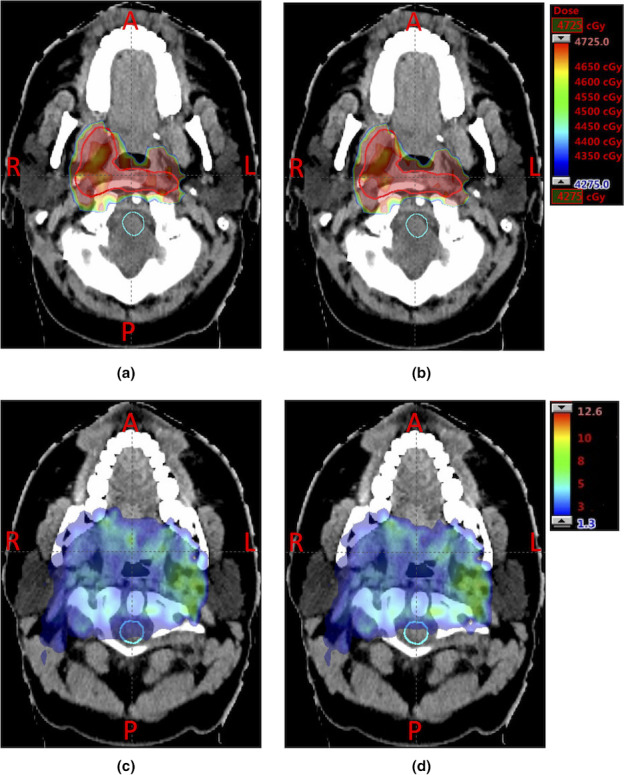
Figure 1.

Comparison of dose distribution assuming a fixed RBE of 1.1 (top row) and LET distribution (bottom row) for case 2 in the nominal scenario. (a) and (b):distribution of dose assuming a fixed RBE of 1.1. (c) and (d):distribution of the LET (unit: kev/μm). (a) and (c) are the results from the conventional model RO; (b) and (d) are the results from our new model RO(BS). Clinical target volume (CTV) and spinal cord are contoured by red (top middle enclosed area) and cyan lines (bottom enclosed area), respectively. In RO(BS), the high LET distribution in spinal cord (comparing (c) and (d)) is considerably reduced, while the physical dose distribution of the tumor is very similar. [Color figure can be viewed at wileyonlinelibrary.com]
