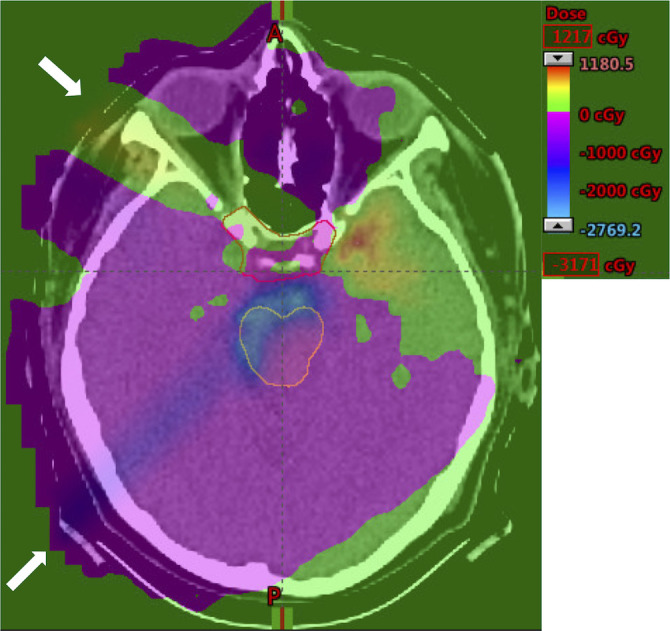
Figure 2.

Difference of doses from the results of the plan derived from the RO(BS) model minus the results of the plan derived from the RO model assuming a fixed RBE of 1.1. A representative transverse slice of case 2 under nominal scenario is shown. For two beams with their directions indicated by white arrows, the RO(BS) model clearly will reduce the intensity of beamlets of the lower beam deposited at the proximal edge of the target (red contour and top enclosed area) when brainstem (yellow contour and bottom enclosed area) is proximal to the target. This effect will lead to an decrease of physical dose (blue area and left bottom gray area) from the RO(BS) model compared with the RO model. Correspondingly, the beamlet intensities in the upper beam parallel to the brain stem will increase to compensate the physical dose in the target. This causes an increase of the physical dose in the red area (top right dark area). [Color figure can be viewed at wileyonlinelibrary.com]
