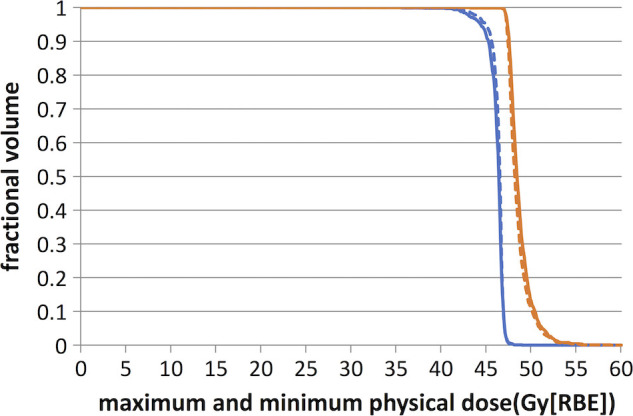
Figure 3.

Comparison of DVH curves generated by the per‐voxel maximum (red and dark) and minimum (blue and gray) l doses of tumor assuming a fixed RBE of 1.1 derived from the models with and without BS terms for the head‐and‐neck cancer case. The new model RO(BS) is represented by solid curves and the conventional model RO by dashed curves. The difference between the DVH curves generated by the per‐voxel maximum and minimum doses of tumor indicates plan robustness. The difference of plan quality and plan robustness is only minor between the two models. [Color figure can be viewed at wileyonlinelibrary.com]
