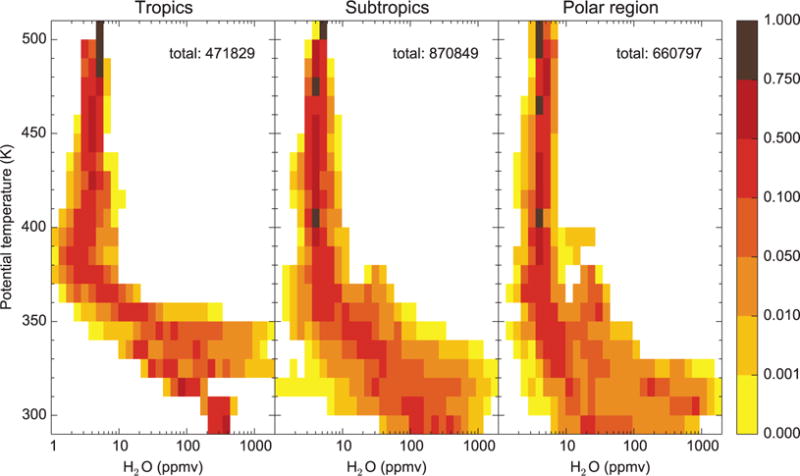
Figure 1.

Potential temperature-based (10 K bins) frequency distribution of water vapor mixing ratios from 23 aircraft campaigns measured with the Fast In-situ Stratospheric Hygrometer (FISH) hygrometer [Meyer et al., 2015] from 1997 to 2014 divided into three latitude regimes: tropical (30°S to 30°N), sub-tropical (60°S to 30°S and 30°N to 60°N), and polar regions (90°S to 60°S and 60°N to 90°N). The number of data points (measurements every second) is given at the top right of the respective panel.
