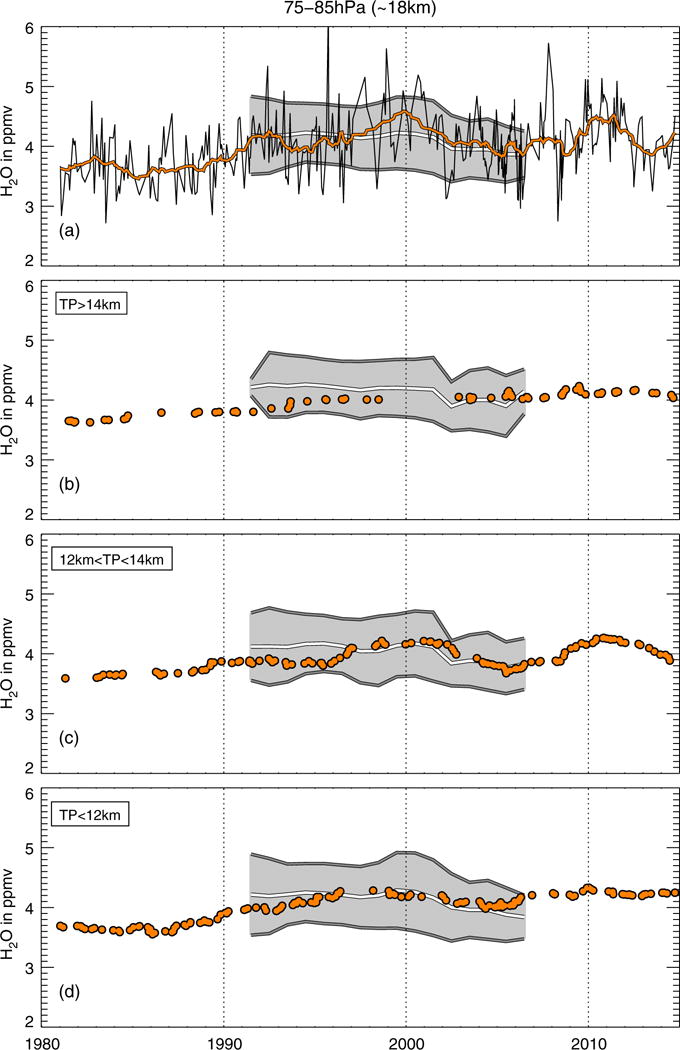
Figure 2.

Stratospheric water vapor between 1981 and 2014 from Boulder sonde data (Hurst et al., 2011; Kunz et al., 2013). Top panel (a) shows data for 75–85 hPa (≈18 km); the panels below show subsets of the data selected according to the altitude level of the tropopause at the individual sounding. Second panel (b) shows data for the tropical domain (tropopause greater than 14 km); third panel (c) for a transitional domain (tropopause between 14 and 12 km); and bottom panel (d) data for the extratropical domain (tropopause below 12 km). The black line in the top panel shows water vapor monthly means; 2-year running means in all panels are shown in orange. Also shown are corresponding HALOE data for 1991–2005 (zonal average of the latitude band 35°N to 45°N); the white line shows the 2-year running mean; the range of two standard deviations around the mean is shown as gray shading [Kunz et al., 2013]. Note that around the year 2000, no data are available for tropopause greater than 14 km (panel b). (Figure adapted from Kunz et al. [2013]; see reference for further information on the analysis).
