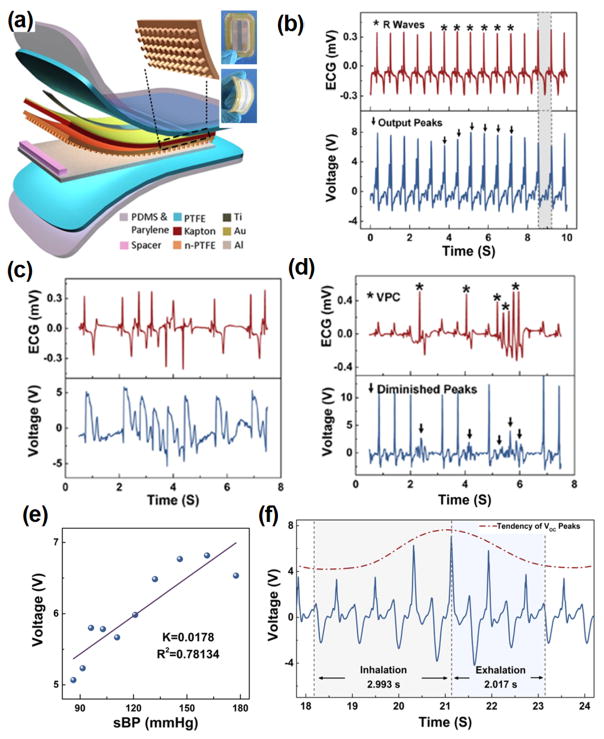
FIG. 11.
(a) Schematic structure of iTEAS. Inset is a photograph of the iTEAS device. (b) R waves of electrocardiogram and output voltage of the iTEAS. ((c) and (d)) Signals from electrocardiogram and the iTEAS sensor when porcine was in atrial fibrillation (c) and ventricular premature contraction (d). (e) Linear fit of output voltage and blood pressure. (f) Output voltage of iTEAS during a breathing cycle. Reprinted with permission from Ma et al., Nano Lett. 16(10), 6042 (2016). Copyright 2016 The American Chemical Society.

