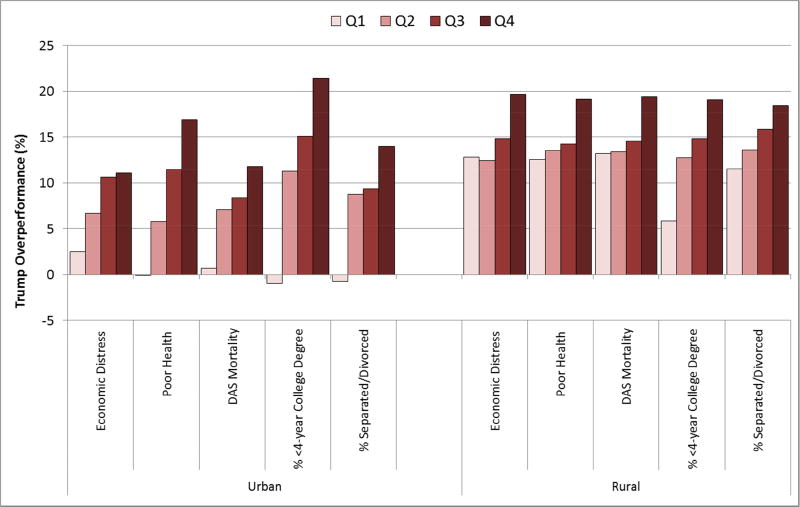
Figure 4. Mean Trump Over-performance by Measures of County Well-Being, Industrial Midwest.
Note: N=504 counties
DAS Mortality =Drug, alcohol, and suicide mortality rate
Urban=USDA ERS RUCC codes 1–3; Rural= USDA ERS RUCC codes 4–9
Q1=bottom 25th percentile (highest well-being); Q4=top 25th percentile (worst well-being)

