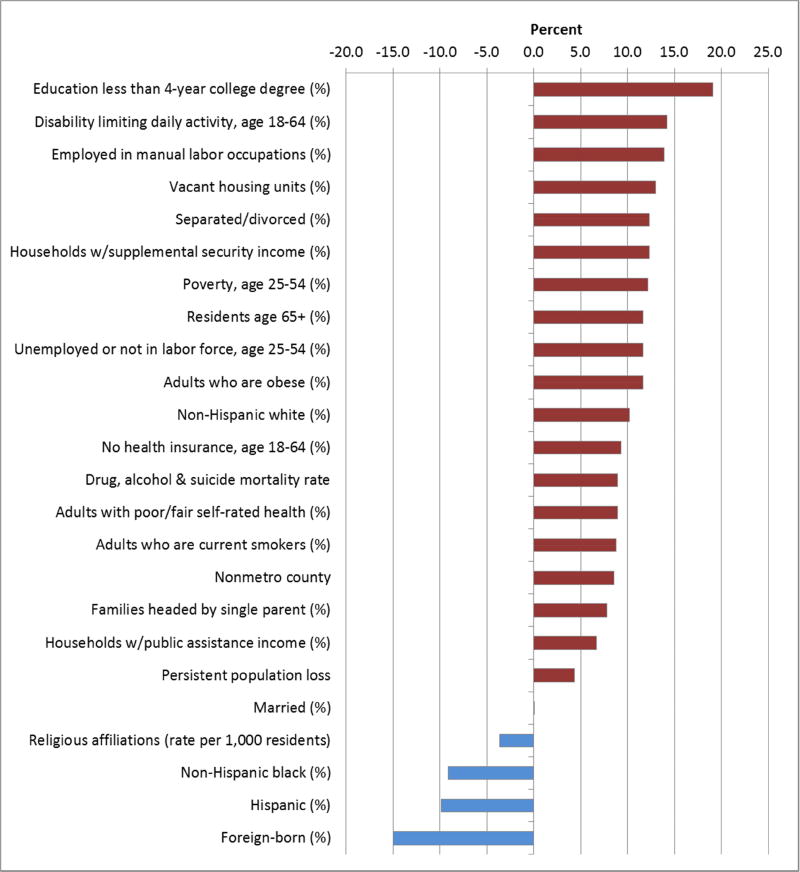
Figure 5. Model-Estimated Difference in Mean Trump Over-performance by County Characteristic, Industrial Midwest.
Note: N=504 counties
Model-estimated differences are from bivariate linear regression models. The bars represent the difference in mean Trump over-performance between counties in the bottom 25th percentile (Q1) vs. top 25th percentile (Q4) for all characteristics except nonmetro county and persistent population loss (both dichotomous). All estimates are from unadjusted models, but all models use clustered standard errors to account for nesting of counties within states.

