
Figure 2.
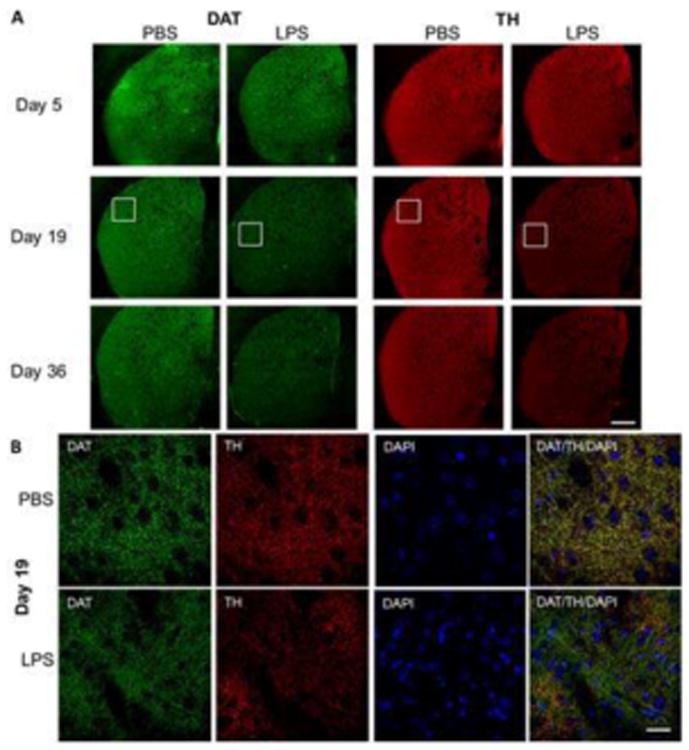
Representative immunofluorescent staining of TH and DAT in striatum of mice exposed to LPS. (A) Brain sections stained for TH (red), DAT (green), and DAPI (blue) is shown at 5, 19 and 36 days since initiation of LPS challenge. (B) Higher magnification pictures for days 5 and 19. Bar = 500 μm (A) and 100 μ (B).