
Figure 7.
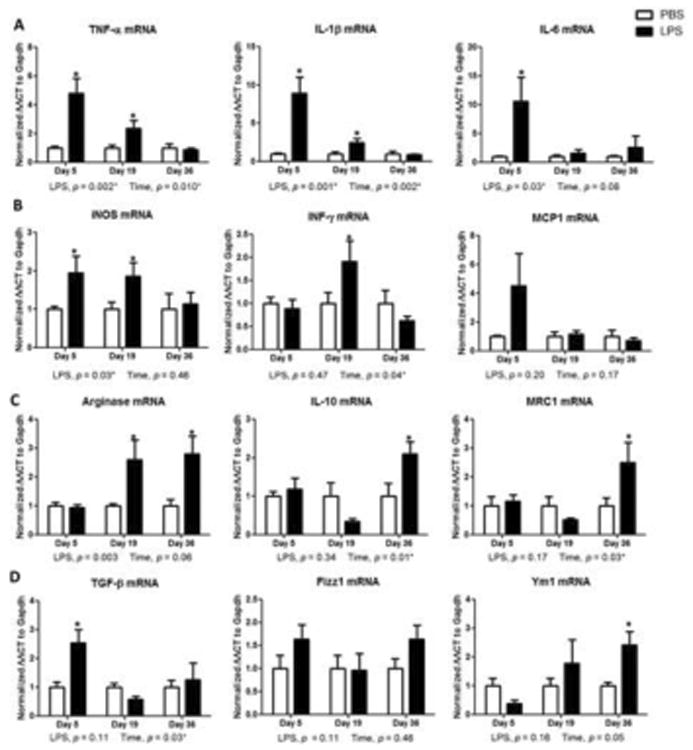
Expression profile of inflammatory genes in striatum of mice. (A) Quantitative PCR for cytokines Tnfα, Il1β, and Il6, and (B) iNos, Inf-γ, and Mcp1 in striatum of mice during course of experiment. LPS induced a strong induction of M1 cytokines at day 5 treatment, and returned to basal levels around day 19. (C) Arginase-1, Il-10, and Mrc1 mRNA expression by qPCR and (D) Tgfβ, Fizz1, and Ym1 in striatum of mice during course of experiment. LPS induced a rise in arginase-1 starting at day 19, and a robust induction of M2 cytokines at day 36 LPS treatment. Data represent mean ± SEM of 4-5 mice/group, *p < 0.05 for treatment effects.