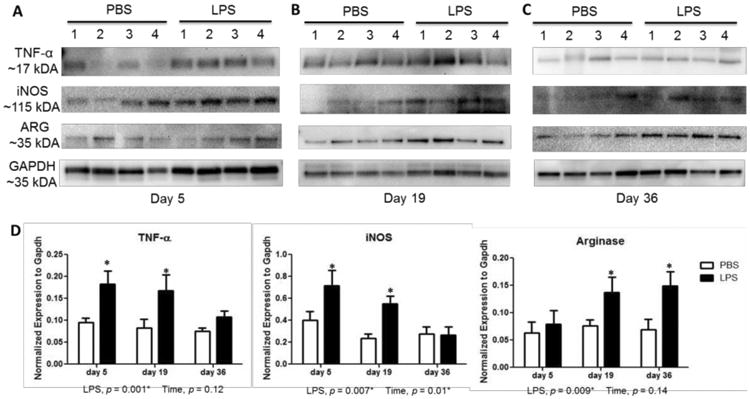
Figure 8.

Inflammation phenotype-specific proteins in striatum of mice after systemic challenge with LPS. Western blot analysis shows an increase TNF-α and iNOS at 5 days (A) and 19 days (B) following LPS administration. Induction of Arginase-1 (ARG) protein levels at 19 days (B) and 36 days (C) after LPS treatment. (D) Westerns were quantified by densitometry and normalized to GAPDH levels. Data represent mean ± SEM of 4 mice/group, *p < 0.05 for treatment effects.
