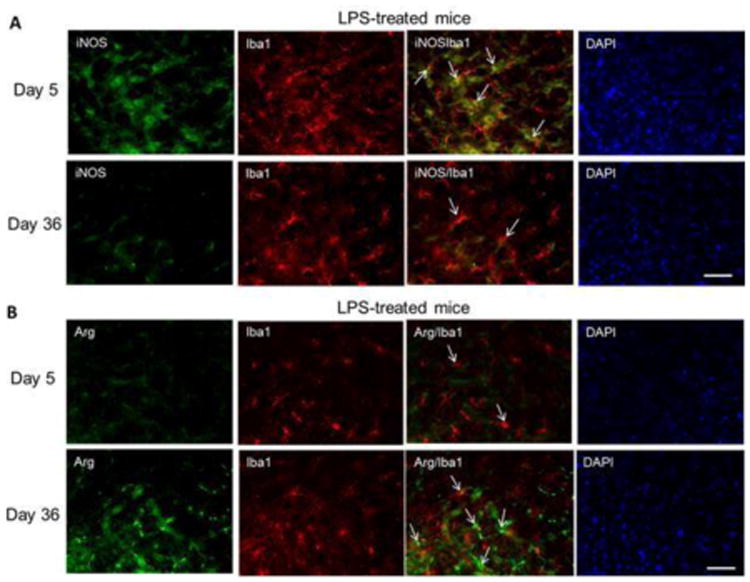
Figure 9.

Expression of iNOS in IBA1+ cells 19 days after LPS treatment shifts to higher arginase-1 protein levels at 36 days. (A) Microglia were visualized by immunofluorescence staining for IBA1 (red) in the striatum at day 5 and day 36. Representative images for iNOS (green) and DAPI (blue) on experimental days 5 and 36 after treatment with LPS. (B) Immunofluorescence staining for arginase-1 (green) and DAPI (blue) in striatum on experimental days 5 and 36 after treatment with LPS. Bar: 50 μm.
