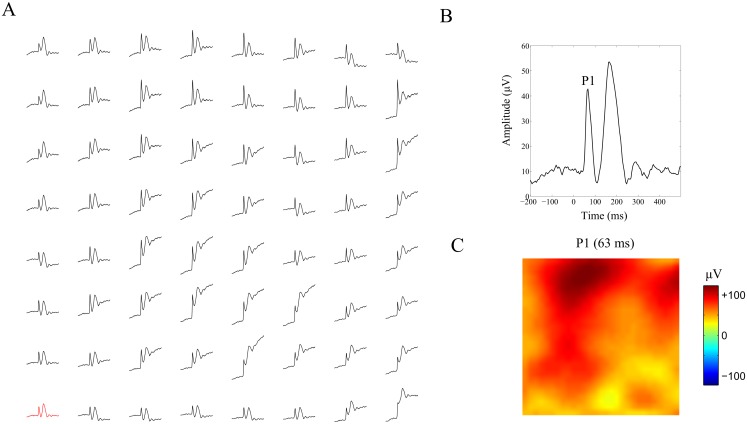
Fig 8. Evoked potentials in macaque primary visual cortex.
A. Multiplot of the visually evoked potentials (VEPs) recorded at the 64 electrodes of the Utah array. Time ranges from 200 ms pre-stimulus to 500 ms post-stimulus. B. Close-up of the VEP at the lower-left corner of the electrode array (red trace in A). Time is relative to stimulus onset. The peaks selected for analysis is indicated by P1 and has a latency of 63 ms. C. Topographic map of P1. All potentials are relative to the single-wire reference.

