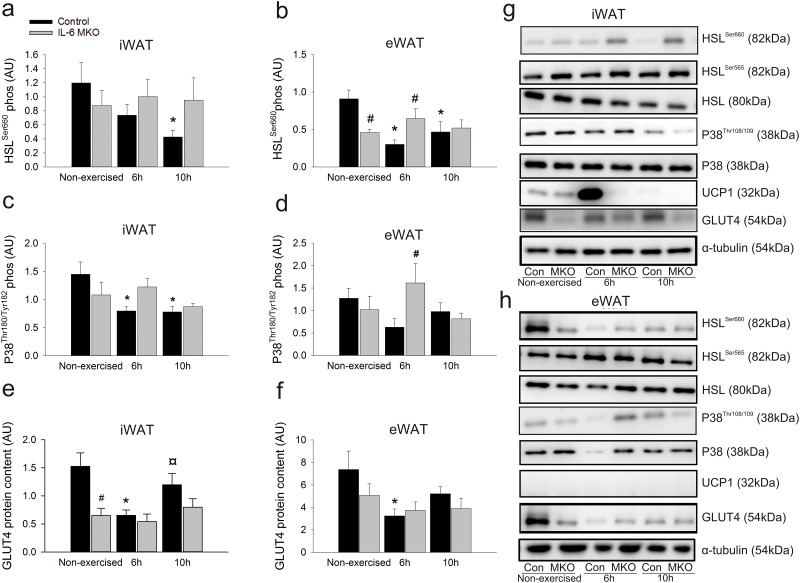
Fig 3. iWAT HSLSer660 phosphorylation (a), eWAT HSLSer660 phosphorylation (b), iWAT P38Tyr180/182 phosphorylation (c), eWAT P38Tyr180/182 phosphorylation (d), iWAT GLUT4 protein content (e), iWAT GLUT4 protein content (f), iWAT (g) and eWAT in non-exercised mice as well as 6h or 10h after 2h of treadmill running in d IL-6 MKO and Control mice.
(h) Representative blots of HSL565 phosphorylation, HSL, UCP1 and P38 protein content. Values are mean ± SE; (n = 9–10). *: significantly different from non-exercised within given genotype (p<0.05), ¤: significantly different from 6h within given genotype (p<0.05), #: significantly different from Control within given time point (p<0.05).

