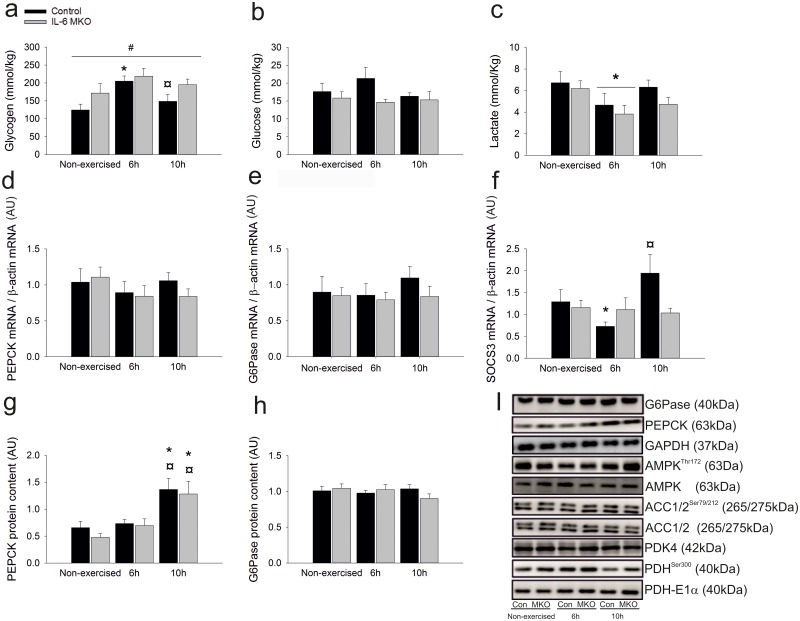
Fig 6. Hepatic glycogen content (a), glucose content (b), lactate content (c) PEPCK mRNA content (d), G6Pase mRNA content (e), SOCS3 mRNA content (f) PEPCK Protein content (g), G6pase protein content (h) representative blots of AMPKThr172 phosphorylation, AMPK protein content, ACC1/2 Ser79/212 phosphorylation, ACC1/2 protein content PDHSer300 phosphorylation, PDH E1α protein content (i) in non-exercised mice as well as 6h or 10h after 2h of treadmill running in Control and IL-6 MKO mice.
Values are mean ± SE; (n = 9–10) *: significantly different from rest within given genotype (p<0.05), ¤: significantly different from 6h within given genotype (p<0.05), #: significantly different from Control within given time point (p<0.05).

