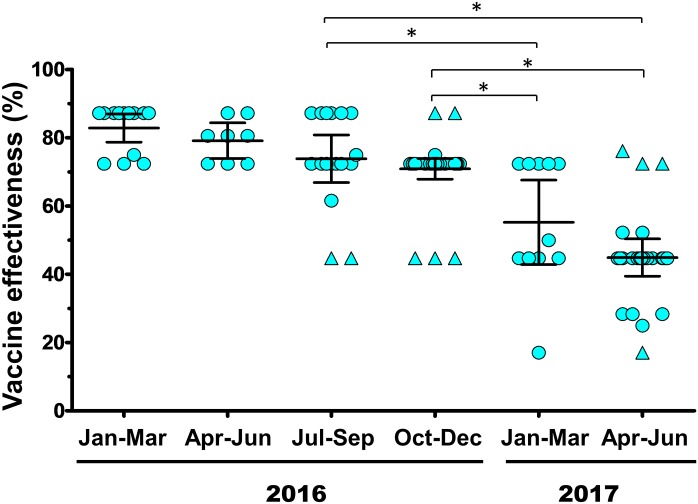
Fig 4. Calculated quarterly vaccine effectiveness between January 2016 and June 2017.
Vaccine effectiveness (VE) was derived using the Pepitope model by comparing the A(H3N2) sequences identified in this study to that of the vaccine strain A/Hong Kong/4801/2014. Circles represent the predicted VE percentage for each strain analyzed, while triangles represent statistical outliers. For each quarter, the middle bar represents the mean value, while the upper and lower bars denote interquartile range. Asterisks indicate statistically significant differences (P<0.01).

