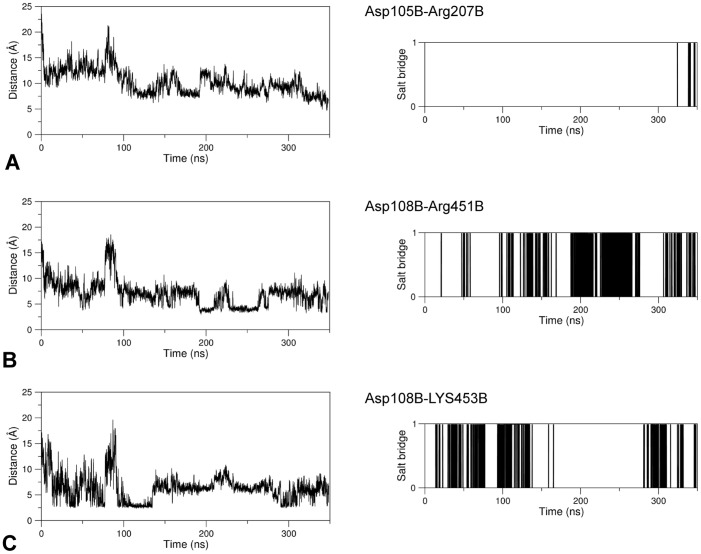
Fig 4. Salt bridge formation and persistence.
Right and left columns of each panel report the graph of the variations of the distance between the center of mass of the oxygen atoms in the acidic side chain and the center of mass of the nitrogen atoms in the basic side chain as simulation time and the plot of existence of the corresponding salt bridge at a given time, respectively. In the latter plot, a vertical bar indicates salt bridge existence at the corresponding simulation time. The salt bridges here analyzed exist only in the GabR holo form over the simulation time. (A), (B) and (C) refer to the pairs Asp105B-Arg207B, Asp108B-Arg451B, and Asp108B-Lys453B, respectively.

