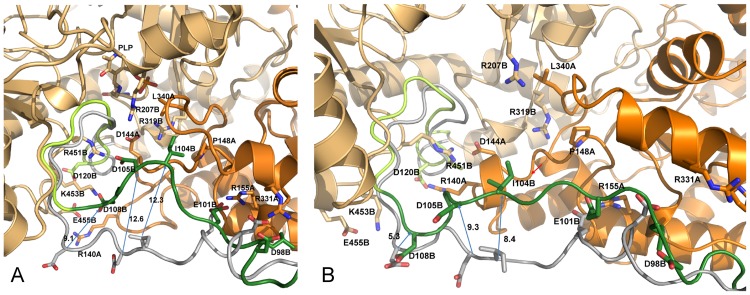
Fig 6. Linker-AAT domain interactions.
Interactions between the linker and the AAT domain of the (A) holo and (B) apo GabR dimer in the last MD frame are displayed. Dark and light orange distinguish the two subunits represented as cartoon models. Green and grey ribbon corresponds to the linker region at the end and at 0 ns of molecular dynamics respectively. The yellow ribbon segment in the last frame structures indicate the loop connecting the linker to the first N-terminal helix of the AAT domain. Relevant side chains are displayed with stick models. Residues are labeled with the one-letter code followed by sequence positions and chain id. Arrows connect positions of equivalent residues at the start and end of MD simulation. Decimal figures associated to the arrows indicate the approximate distance between the Cα carbons of the connected residues. Red arrow in (B) points to the one-turn helix.

