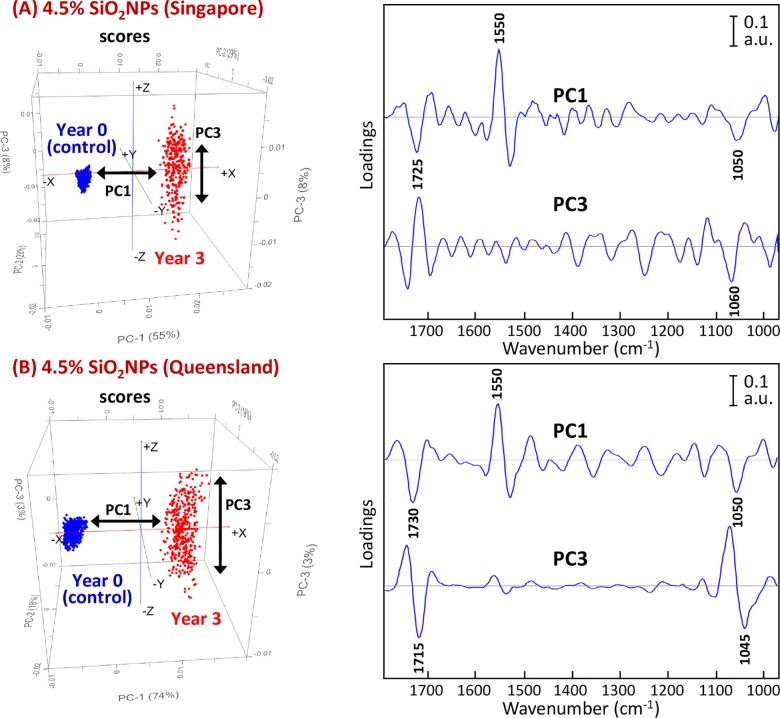
Fig 7.
PCA score (left) and loading (right) plots based on high-resolution synchrotron macro ATR-FTIR spectra of 4.5% SiO2NPs polyester composite coatings showing the projection against the first PC (PC1), which explains the majority of the spectral variation between their control and after 3 years of exposure to (A) tropical Singapore and (B) sub-tropical Queensland climates. Note that the PC3 loadings plot is also included for comparison.

