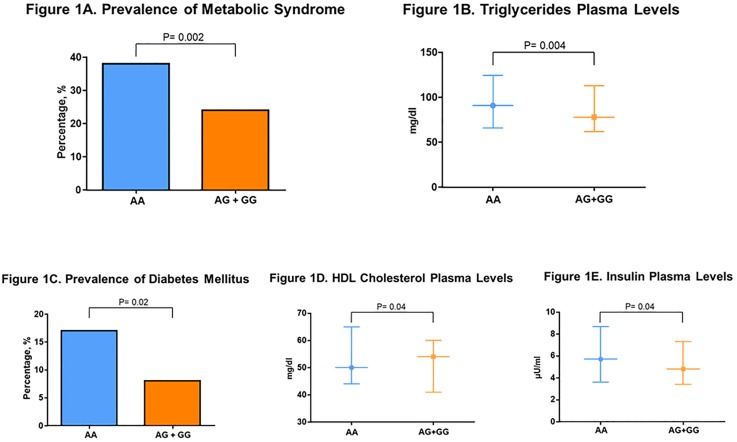
Fig 1. Metabolic phenotype according to rs5068 genotypes.
A. Prevalence of Metabolic Syndrome. P value obtained from regression analysis adjusted for age and sex. B. Triglycerides Plasma Levels. P value obtained from regression analysis adjusted for age, sex and body mass index in a subgroup of subjects not taking lipid-lowering therapy (n = 1370). Values are median, first and third quartile. C. Prevalence of Diabetes Mellitus. P value obtained from regression analysis adjusted for age, sex and body mass index. D. HDL Cholesterol Plasma Levels. P value obtained from regression analysis adjusted for age, sex and body mass index in a subgroup of subjects not taking lipid-lowering therapy (n = 1370). Values are median, first and third quartile. High-density lipoprotein (HDL). E. Insulin Plasma Levels. P value obtained from regression analysis adjusted for age, sex and body mass index in a subgroup of subjects free of diabetes mellitus (AA = 1247, AG+GG = 102). Values are median, first and third quartile.

