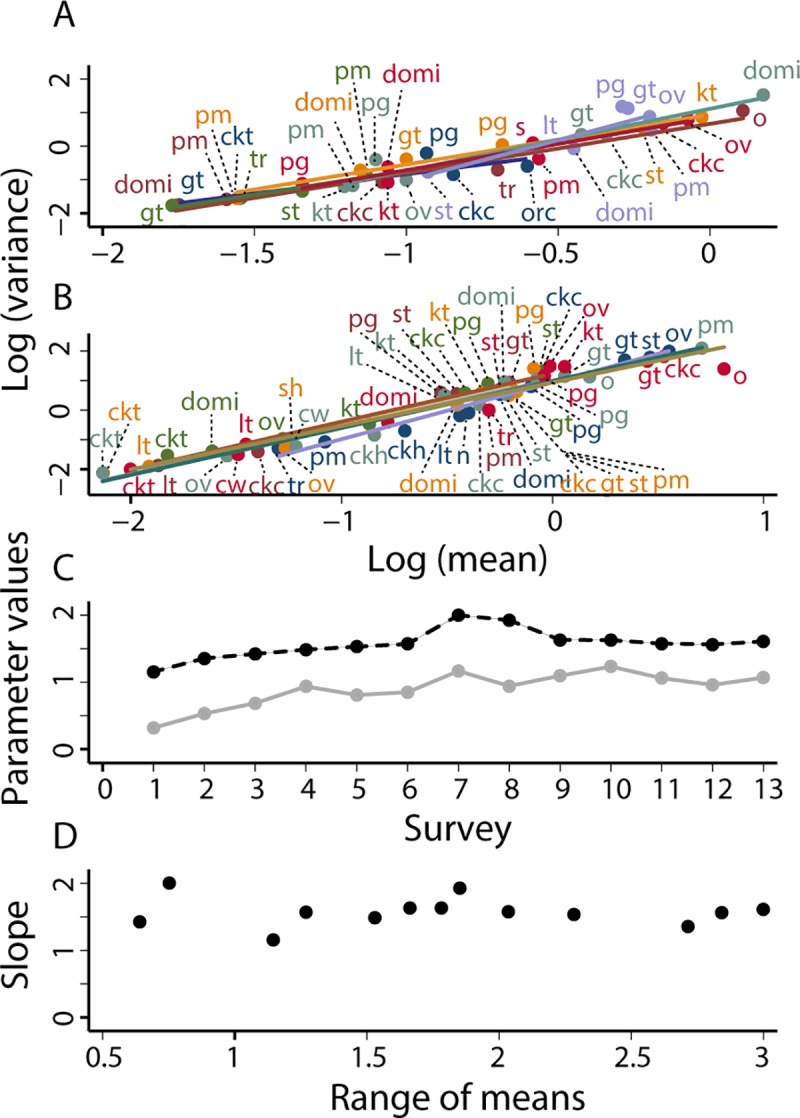
Fig 3.

For T. infestans in the Amamá core under sustained vector surveillance and control, in (A) surveys 1 (October 1993) to 7 (May 1997) and (B) surveys 8 (November 1997) to 13 (October 2002), TL described the relationship between y = log10 v and x = log10 m of the relative abundance of T. infestans. Each point represents the mean and variance of bug abundance for one habitat at one survey. The solid straight lines are fitted by least-squares regression to the data from each survey separately. (C) Values of the parameters a (solid gray line) and b (dashed black line) of TL at each of the 13 surveys. (D) Slope b as a function of the range (maximum log10 mean minus minimum log10 mean) of the number of bugs. The greater the range, the smaller the variability in b. Key as in Fig 2.
