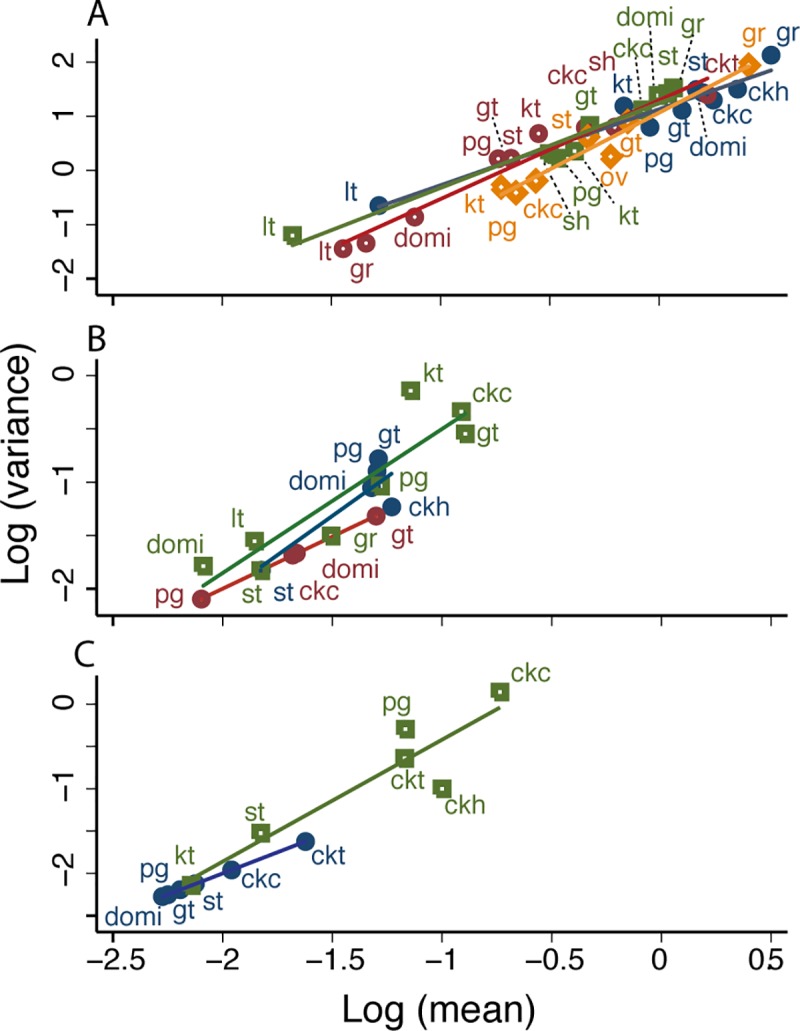
Fig 6.

In Figueroa [34], TL described the relationship between y = log10 v and x = log10 m of the relative abundance of T. infestans (A), T. guasayana (B), and T. garciabesi (C) in 10 (peri)domestic habitats with positive mean abundance surveyed just before community-wide spraying with insecticides in October 2003 and during follow-up monitoring surveys of house/habitat infestations in which reinfested houses were selectively re-sprayed with insecticides in March and October 2004 and March 2005. Each point represents the sample mean and sample variance of bug abundance for one habitat on a specified date. The solid straight lines are fitted by least-squares regression to the data from each survey separately. Blue (solid circle), orange (diamond with white dot), red (circle with white dot), and green (square with white dot) points and lines represent October 2003, March and October 2004 and March 2005, respectively. Key to habitats as in Fig 2.
