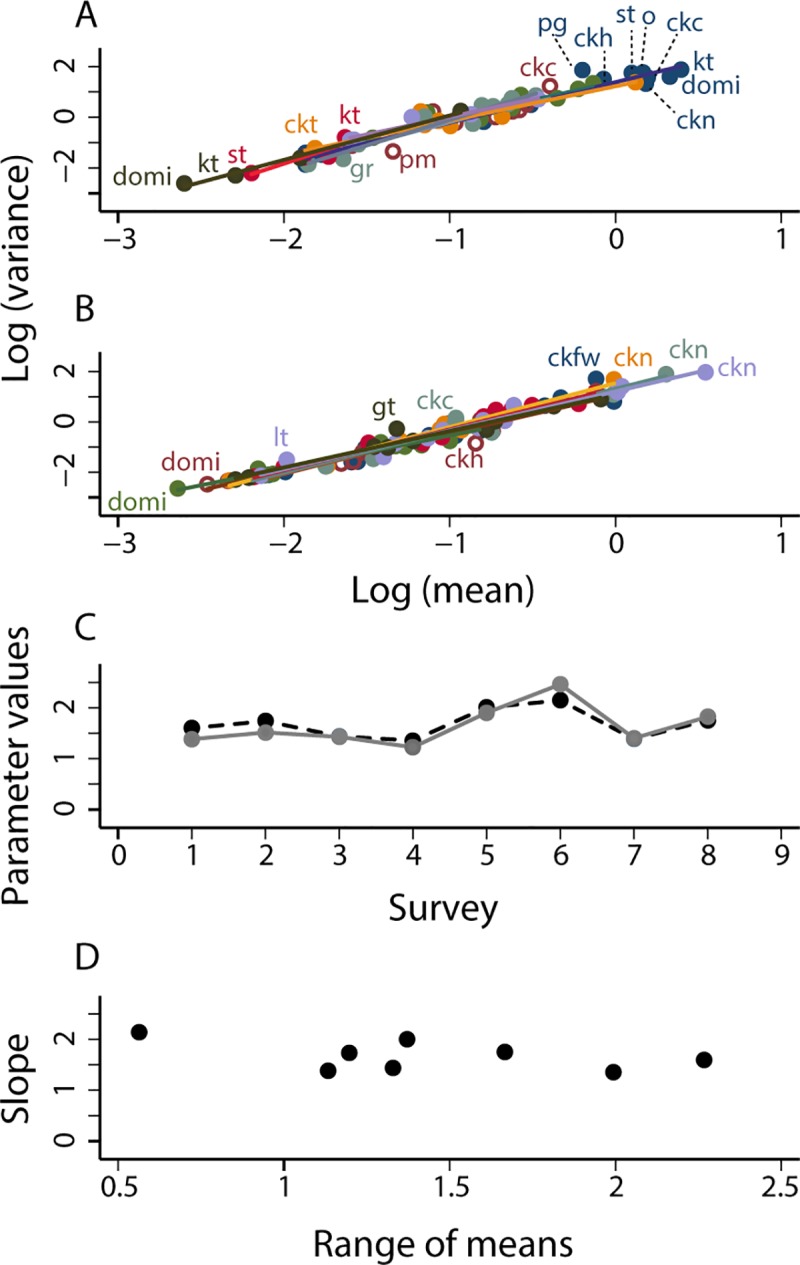
Fig 7.

In Pampa del Indio [36], TL described the relationship between y = log10 v and x = log10 m of the relative abundance of T. infestans (A) and T. sordida (B) in 13 (peri)domestic habitats at survey 1 (October 2007, preintervention) to survey 8 (October 2010). Each point represents the mean and variance of bug abundance for one habitat and insect species. The solid straight lines are fitted by least-squares regression to the data from each survey separately. Key as in Fig 2. (C) Values of the parameters a (solid gray line) and b (dashed black line) of TL for T. infestans at each of the 8 surveys. (D) Slope b as a function of the range of the number of bugs for T. infestans. The greater the range, the smaller the variability in b.
