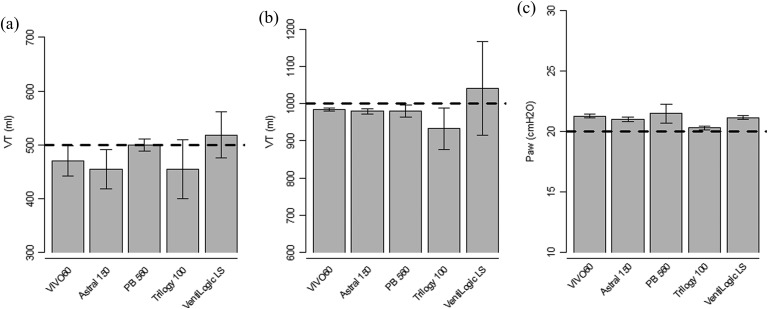
Figure 2.
Delivered tidal volume and airway pressure in stable state without leaks. Bars represent mean tidal volume (VT), respectively, airway pressure (Paw), whiskers represent the 95% confidence interval. (a) Volume-controlled setting (VC-CMV) with VT 500 mL; (b) VC-CMV with VT 1000 mL; (c) pressure-controlled setting (PC-CMV) with inspiratory pressure set at 20 cm H2O.

