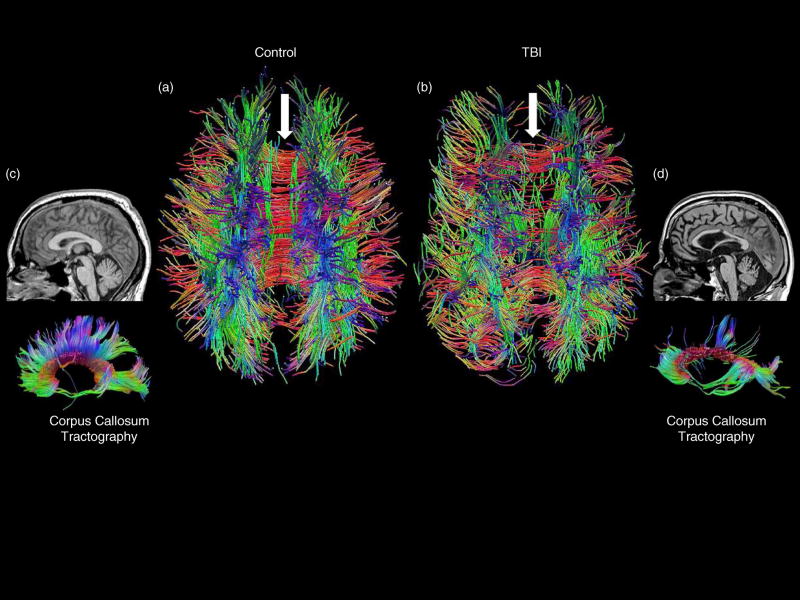
Fig. 2.
(a) Dorsal view of an age-matched control whole-brain tractography image compared to (b) a patient with severe TBI. The white arrows point to the corpus callosum, which is intact in the control but with major tract loss in the TBI patient. Likewise, a mid-sagittal T1 MRI view shows an intact corpus callosum in the control subject (c) and a withered, atrophied one in the TBI patient (d). More dramatically, DTI tractography of the corpus callosum shows extensive loss of callosal tracks in the TBI patient compared to the control.

